


The Great Texas Freeze – Beyond the Flaw of Averages
The Great Texas Freeze – Beyond the Flaw of Averages
A reminder of why we systematically underestimate risks and how to read the news
We have long suggested Sam Savage’s book, The Flaw of Averages. It is a start at understanding why you should ignore a great deal of the coming analysis of the Great Texas Freeze, or the GTF. So, here is a handy guide to reading news about the GTF without becoming confused.
First – the Flaw of Averages
Sam’s book explains why an “average power outage” is meaningless. Suppose you had outages which averaged 23 minutes, per hour, based on an average of 70 outages of 15 minutes, and one lasting 10 hours. The one long outage defines your experience. It’s enough to freeze pipes while spoiling food in your refrigerator. This is the point of Sam’s book; a statistician who drowned in a river averaging less than four feet deep; he stepped in the one hole deep enough to die.
When you read any analysis with the word “average” remember, “average” means “systematic underestimate of risk.”
Moving Beyond the Basic Flaw
The GTF takes us beyond the basic flaw of averages. This event had four characteristics, which made it severe:
- Duration: Depending on where you live, temperatures were below freezing for 100 – 200 hours. In Texas, this is a long time.
- Breadth – Texas has 254 counties. All were included in the disaster declaration.
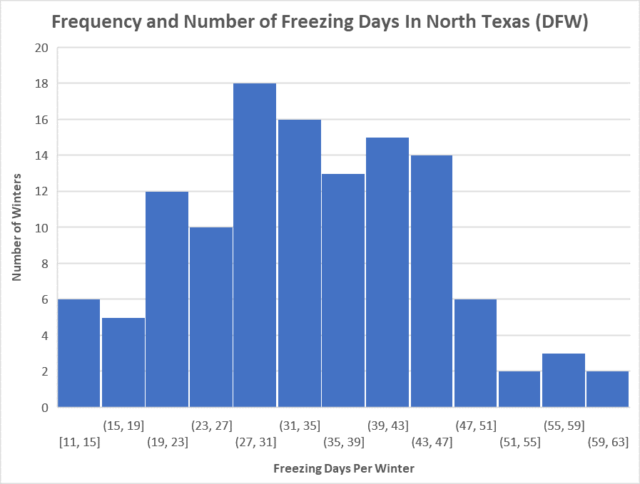
- Temperature Extremes – The National Weather Service has records of 123 winters for the Dallas area (including this one). This is only the 5th time we have seen temperatures below zero.
- Changes in the Texas Electric Generation and Demand – Since our last deep freeze 30 years ago, a lot has changed.
Correlation – it matters… a LOT.
What is interesting about these four factors is their correlation. The length, coverage, and extremes are all correlated. Over the past 122 prior winters, there is a good (52%) correlation between the lowest recorded temperature of the winter, and the number of freezing days recorded that winter. That makes sense when you think about how cold weather happens. It takes time for a cold front to drive temperatures down. So, we’d expect there’s some relationship between how cold it gets, how broadly the cold covers the map, and how long we spend below freezing.
If it makes sense our measures of weather severity are correlated, what about the power grid?
The Power Grid’s Vulnerability Has Become Dangerously Correlated with Cold Weather Demand.

This is where correlation comes in.
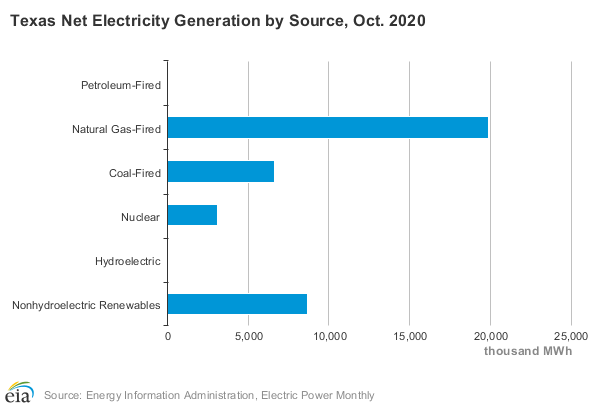
In the winter of 1989-90, Texas had a lot of coal-fired electrical generation and the state’s newest nuclear plant came online in 1990. Recently Texas has lost about 1,000 Megawatts of coal-powered electricity every year. To meet the growing demand for power, Texas added natural gas, solar, and wind-powered generation. Texas has been adding wind power at a rate about five times greater coal has been dropping offline.
Nuclear and coal provide only about 25% of the state’s power. The other 75% (gas, wind, solar) all have features, which make their output correlated to temperature. In other words, the colder it gets, the less energy gas, wind, and solar can actually provide. What happens when many of the windmills are frozen at the same time natural gas supplies are impacted by cold weather and snow has covered the solar cells? A lot of power goes offline or is curtailed.
Gas pressure goes down as temperature drops. Long cold spells chill pipelines, reducing the flow, or even freezing the pipeline if there is water or hydrates in the gas. When the pipelines freeze, the solar panels are covered in snow and simultaneously the wind turbines are frozen, zero energy is being produced. That’s a pretty severe correlation. The correlation in power generation is made worse by the correlations in weather characteristics.

What we’d expect is the winters with many days of freezing weather are the ones where natural gas demand is high, and where gas pipelines have trouble keeping up as the combination of demand is compounded with the loss of pressure from temperature effects. Meanwhile, we expect wind and solar to have problems at the same time.
In summary
The average number of freezing days recorded at DFW is about 34, and the average low temperature for the year is about 14 degrees, but those averages don’t matter when we see sub-zero temperatures. In those winters, we have longer cold spells, and today’s power system is simply not designed to cope.
The flaw of averages is believing averages mean much. What matters, in this case, is the connection between the cause of demand and the cause of diminished generation. Long, deep cold is the cause in both cases. Texas rarely needs on-site gas storage for our power plants and other cold-weather mitigation, but with the power system of today, we need these things a lot when we do need them.
That looks to be about every 25 years or so.