


Risk and Uncertainty through Fantasy Football
Growing up, I loved math. I still do, but it started early. I was the kid who raced to get homework done and then went to help everyone else finish theirs. Somewhere in the ’90s, Fantasy Football started taking off, and it was a great intersection of things – a chance to watch SportsCenter, a topic where I could be smarter than my dad, and a (practical?) use for all that math. In fact, I think Fantasy Football may be the most relevant avenue to introduce mathematical concepts to the masses. Today, I will talk about Risk and Uncertainty analysis through that lens.
It’s a human thing to rethink past decisions. Like most things, 2020 was a dumpster fire for me – it was the first year since 2007 I didn’t play Fantasy. This meant I got extra time to stew on the 2019 season. My team, the Hawaiian Organ Donors, had performed well but just missed the playoffs. I kept wondering what could have been done differently…so like my true inner math-nerd, I made a model.

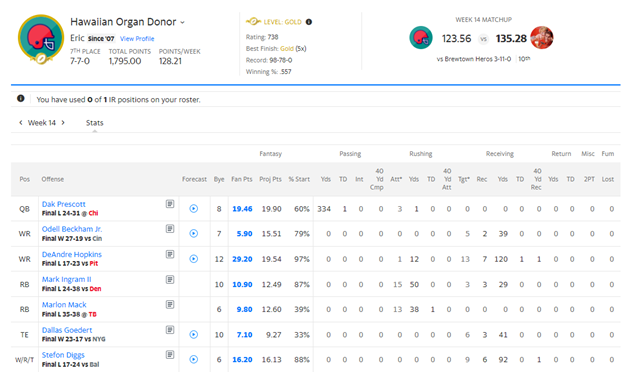
So close…but yet so far from Glory.
First, I had to get a good baseline of my team as it existed. This required representing the rules of the game – Point per Reception scoring, one Flex position, Head-to-Head matchups with only the top 4 of 12 teams making playoffs – and filling out the data that was known. The next big thing was to capture the inherent variability of football on a week-to-week basis – I did this by using TruNavigator®, a modeling builder that treats inputs as uncertain variables and lets that probability flow through any mathematical construct. For instance, Dak Prescott was my Quarterback (QB) and averaged 24 points per week throughout the season – for my purposes, I represented his output as a range of outcomes from 8 to 35 points, with a median value of 24.


Nothing like Math to make sports more interesting!
So now that I had a Baseline, I could better understand where my strongest and weakest positions were and quantify the risk and uncertainty of my lineup. First, I looked at my projected Win total. Because each week I was matched up against a single opponent, there is quite a bit of variability in weekly outcomes. Good teams will tend to perform well over the course of the season, but outcomes shift substantially based on luck. By Week 14 (the cutoff for the playoffs), I was projected for anywhere between 5 and 10 wins, with a Most Likely outcome of a 7 win, 7 loss record – this was my actual record, so at least we know the solution is working as intended.


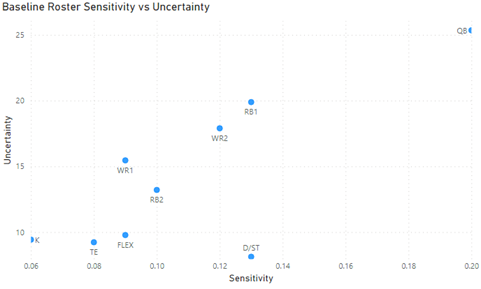
Now comes the fun part – second-guessing draft decisions. I wanted to look at my primary lineup to see what I could have done differently, or to put it more proactively, what lessons I can learn for future drafts. There were a couple of ways to inspect results. First, I looked at an Uncertainty versus Sensitivity analysis – this provides a way to prioritize items that both have lots of inherent variabilities and a lot of impact on the final outcome. I also did a small excursion to see the impact of the variability of my team’s win total – I wanted to bound potential answers to see how good (or bad) it could get.

Hawaiian Organ Donors as a statistical analysis
In Fantasy, there are two kinds of variability. The first is uncertainty in how a player is going to be used. This is driven mostly by coaching decisions and injuries, and these are both largely unforeseeable, so we’re not going to spend any time trying to predict them. In contrast, the second kind of variability is foreseeable. This is the week-to-week boom and bust players that create monster weeks but then just as easily disappear. Some players have the reverse where their ceilings are relatively low, but they also have a higher floor, i.e., they have a tighter range of outcomes. This is the variability we want to focus on.


It can’t get much better, but it could be a whole lot worse.
So from just looking at the Baseline and two simple excursions, we have a few conclusions:
1. Averaging the same Team Point Total with no variability from week to week lowers my odds of making the playoffs from 38% to 30%. This emphasizes the need for a balanced mix of stable and more volatile players.
2. My QB, RB1, and WR2 all performed and had a good mix of upside and raw point totals. If I am going to improve my team, RB2 and FLEX are likely candidates to get better.
3. I started with a 38% chance to make the Playoffs. In a 12 team league, this is already higher than you would expect (4/12 = 33%). I can second guess my team (and I will!), but there will always be some chance a good team gets unlucky.
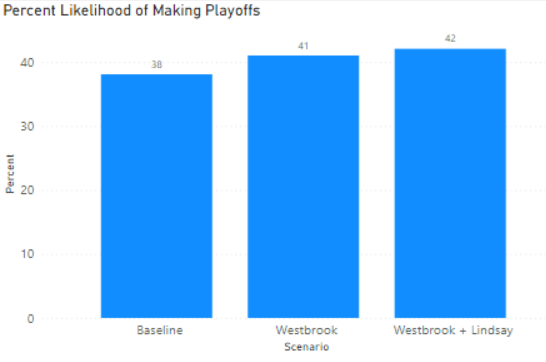
I focused a few scenarios on Point #2 – which players could I have targeted with similar costs, similar information, but with different risk profiles.
• For the RB2 position, I subbed Marlin Mack, my plodding two-down running back on a subpar team for Philip Lindsay, a running back with more week-to-week upside and a more integral part of a potentially explosive offense. Both were 6th round picks.
• For the FLEX position, I subbed DJ Metcalf, a rookie receiver on a good but very conservative offense for Dede Westbrook, a talented deep threat on a team that was likely to be forced to pass, pass, then pass some more. Both were available in round 12.

Sometimes you need some volatility.
The impacts are relatively small, 2-3% higher chance by picking either one and 4% higher by picking both, but Fantasy lives and dies by taking small edges and pushing them consistently. The moral for me here is to target players with a more risky point profile in the middle to late rounds – getting consistency out of a bottom-of-the-roster player does not have nearly as much value as a player who can perform over-expectation win a week single-handedly. A good team thrives on balancing risk and reward.
This exercise showed a lot of the same things I encounter in our professional analytics engagements at Lone Star – the need to manage risk, investment, and performance in the face of uncertainty. The themes ring true whether the topic is Fantasy Football, financial analysis, R&D portfolio management, Mergers & Acquisitions, or Competitive Pricing. This requires a specific type of analytics software – we use TruNavigator®, AnalyticsOS™, and TruPredict® to deliver solutions – and a shift in mindset to represent uncertain outcomes correctly. The upside is that you can move these problems from maddening exercises stuck in your head to quantifiable solutions that can provide tangible insights. I guess the answer always was that I needed to do just a little more math!